


Blockchain decrypting newsletter:
by sskninja

summary:
→The S&P 500 had a worst say on Tuesday after market pricing for fed policy rates went haywire, in this article we will take a look at the latest expected path for monetary policy , and how the fed decisions are affecting the risk markets.
→As of now we are now less than two weeks from the FOMC meeting , CME futures data is predicting that US will likely to follow Canada and EU’s move for 75bps increase to the FFR.
→ the 2-10 year treasury yield spread remains inverted at -.20, and while it has recovered significantly since august , its is in lowest since 2000.
→bitcoin found support at $18.6k and , at the time of writing.
→STH vs LTH realized price within 1.4k.
→ bitcoin is approaching its 1 year of ATH.
→Marketcap to Thermocap nearly is in buy region.
→The white house begins top realize the impact that mining has on the incentivizing the build-out of renewable energy.
→ Hash price($/TH/day) has made a new lows seen since October 2020.
HASHRATE:
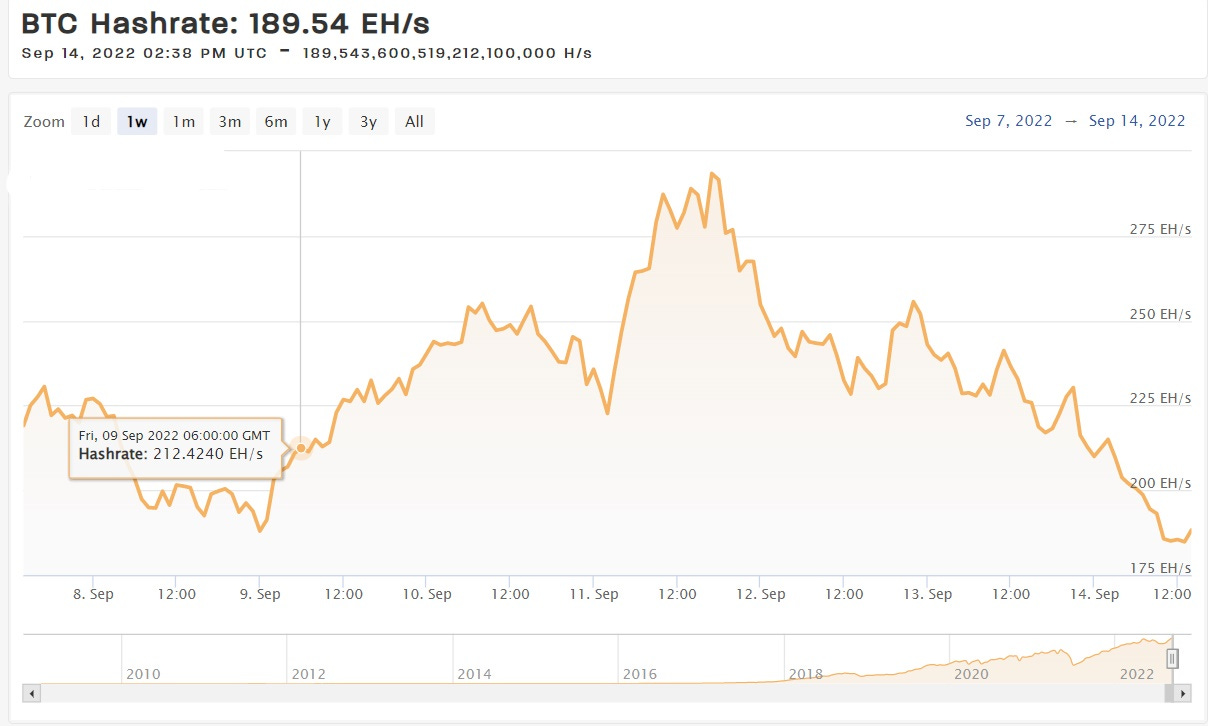
→bitcoin Hashrate is a calculated numerical value that specifies an estimate opf how many hashes are being generated by bitcoin miners trying to solve the bitcoin the current bitcoin block or any given block .
→ The global, bitcoin network Hashrate is a calculated value and is measured in hashes per second(H/s). the calculation uses the current mining difficulty and the average bitcoin block time between blocks versus the defined block time as a variables determines the global network Hashrate .
→

→ For further information visit : Bitcoin Hashrate
General market update :
The fed open market committee(FOMC) will be in two weeks (September 21) to determine the next move for interest rates in US.
On Wednesday we saw the bank of Canada hike their rates by 75 bps to the highest level since 2008 .then on Thursday the European central bank also increased the rates by 75 bps , their largest increase in the history.
CME fed watch tool

As you can see above, the Fed Watch tool is currently predicting an 86% probability of a third-consecutive 75bps FFR hike.
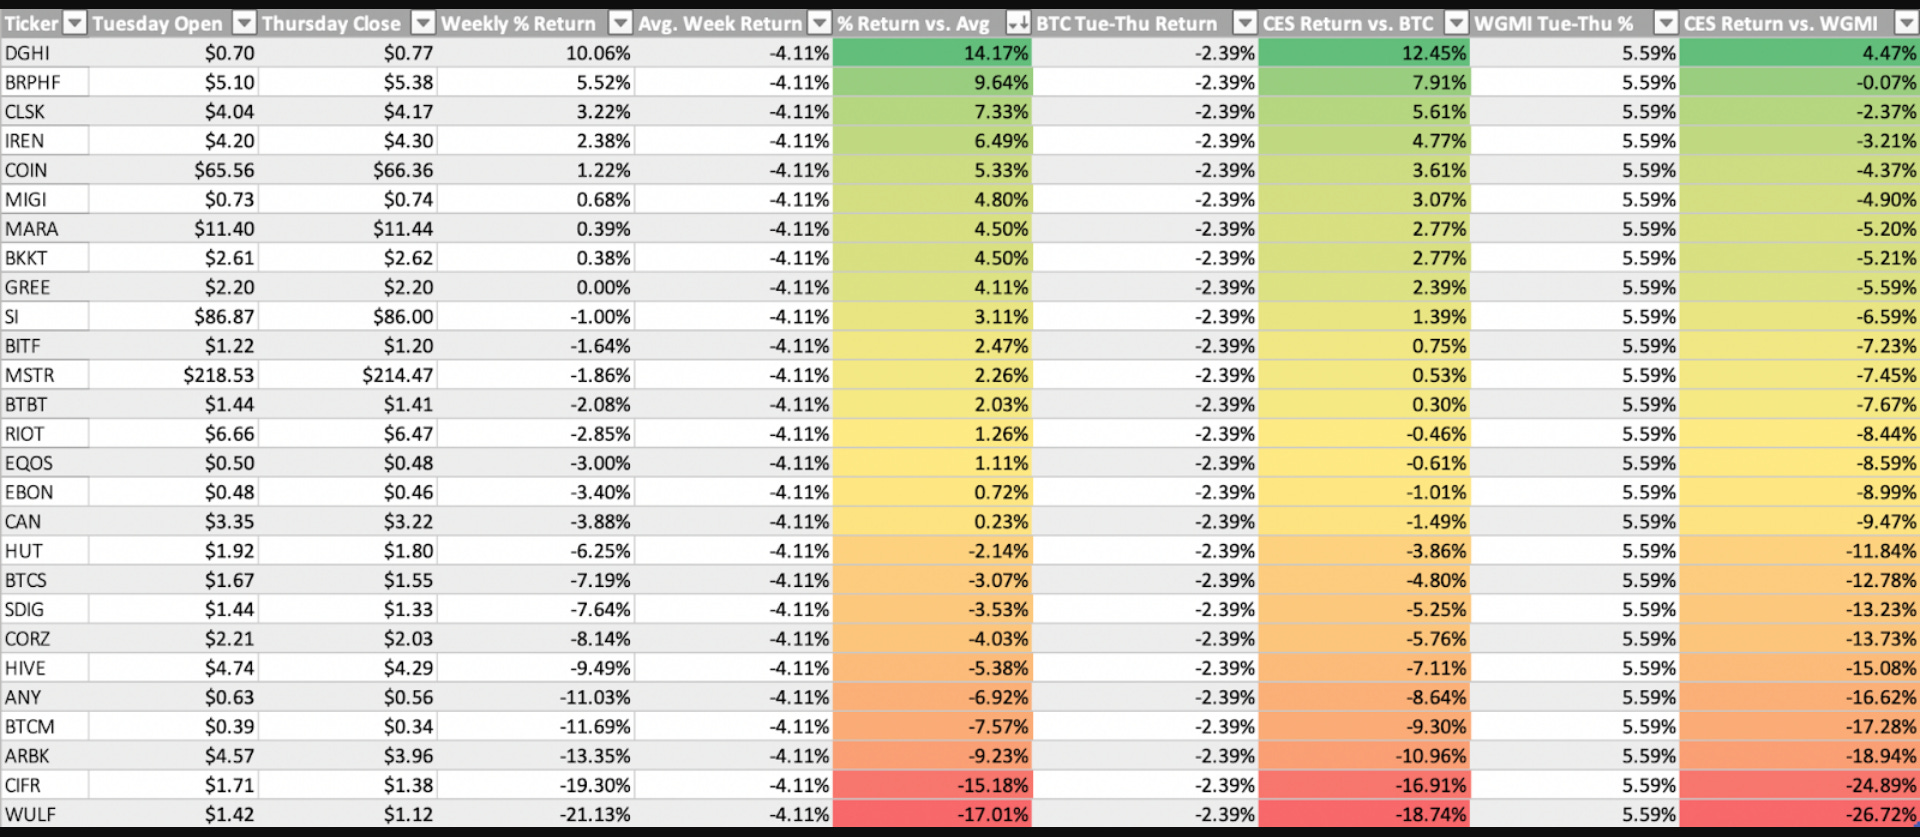
Crypto Exposed Equities:
→ It’s been a relatively stronger week in crypto exposed Equities ,the better performance is coming from: MARA ,RIOT, CLSK and SI.
BITCOIN technical analysis:
On Tuesday, Bitcoin broke below the flag range that we highlighted and predicted in this section last week.

As of Friday morning, we’re seeing BTC gain fairly strong support around late-June and early-July levels. Above we’ve left the levels highlighted in this newsletter last week, our discussion of a pullback to $18,600 before bouncing has played out to a T.
It’s likely that the buyers here are strong enough to keep price afloat for a bit, but it’s more likely than not that price continues lower rather than retaking the August highs.
Tuesday’s selloff came on relatively large volume, ~55% larger than its 50-day average. Wednesday’s candle was supportive and regained some momentum, but the buying wasn’t enough to drastically change the current price structure.
On Friday we’ve seen strong bids for BTC pushing price back higher, the volume candle for today will likely be massive too. One thing to watch for is a reversal in price.
BTC currently has a massive volume shelf sitting overhead at about $19.7K-21.6K. The volume profile indicator (shown on the chart above) shows us volume from a vertical perspective.
The regular volume indicator shows us the amount of coins being traded each day, volume profile shows us the amount of coins traded at each price level. When there is a lot of volume sitting overhead, we can expect some of this volume to turn into profit taking selling.
Thus far, BTC has handled this overhead supply well, but keep in mind the psychology of looking to get out at breakeven. That is why a downside reversal candle is a concern of ours.
If that isn’t the case, $21.7-21.8K is a likely area to run into some resistance.
Bitcoin on chain and Derivatives:
→ Realized price
The long term holder price and the short term holder price are now within $1400 of each other.
STH realized price crossing below the LTH realized price will be a strong signal that we are in the deepest part of bear market.
BTC stacked at this time will likely be extremely valuable in 2-5 years.

→ Puell multiple
This measures the daily issuance value of BTC (in dollar terms) with the 365 day moving average of the daily issuance value. Dollar-cost averaging in this range has historically been a very wise move.

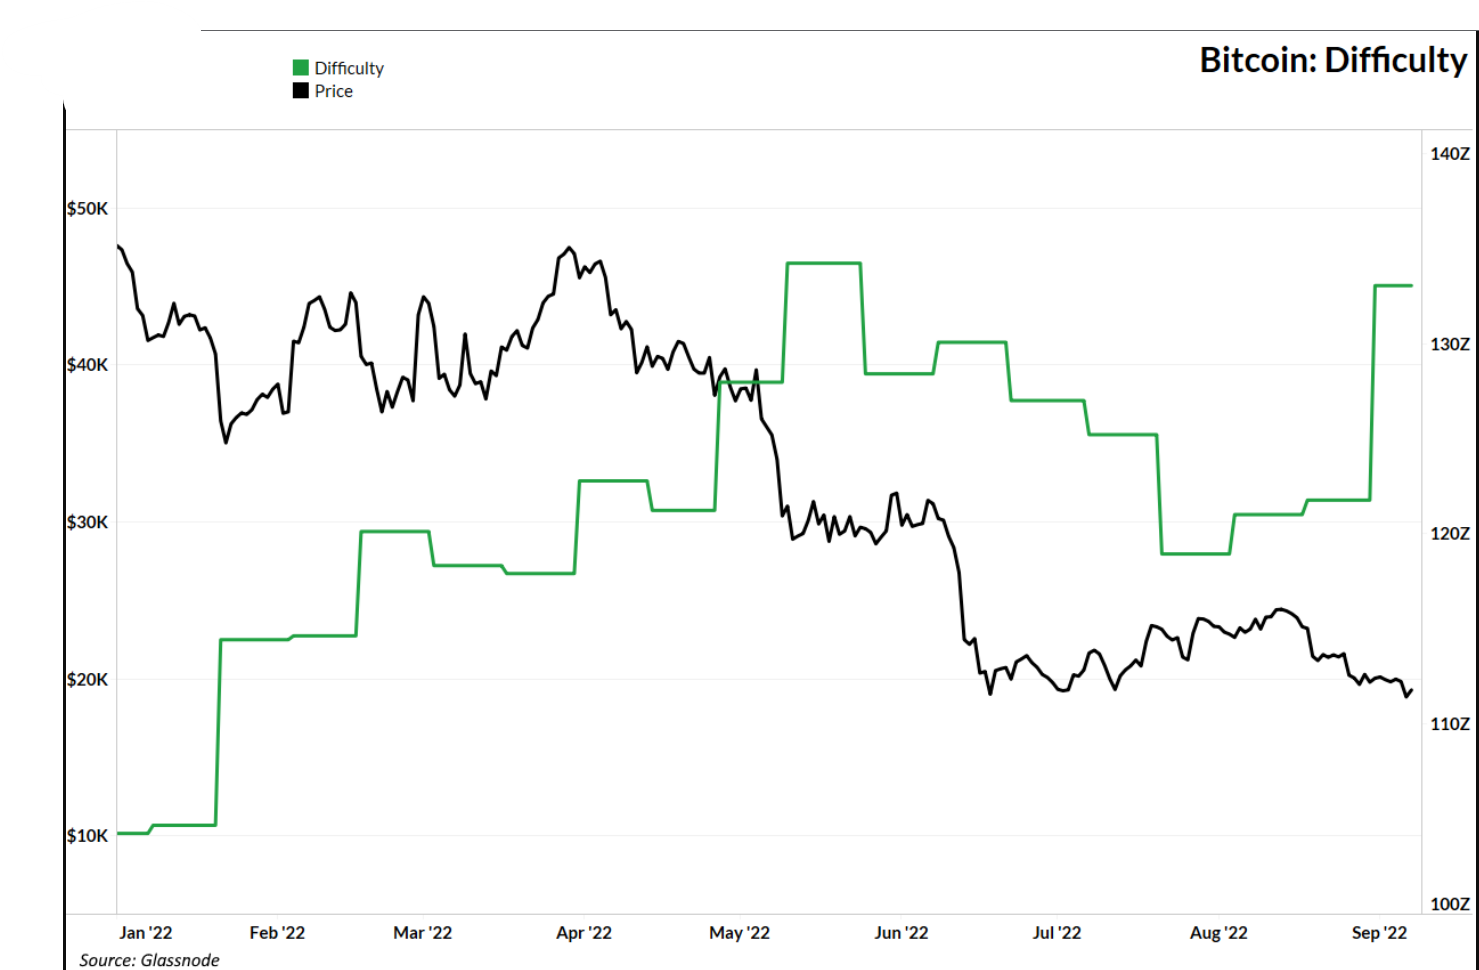
Marketcap to Thermocap Ratio is a measurement of miner profitability. This measure is further evidence of the relative mild intensity of this cycle’s bull run. Moreover, it has not yet entered the value zone during this bear market. We will be keeping an eye on this ratio to understand the current status of bitcoin miners.
Juxtaposing Market Cap to Thermocap Ratio gives insight into the resilience of Bitcoin miners and thus the Bitcoin network as a whole. Despite miner profitability being at extremely low levels, more hash rate has been coming online recently. Last week we saw a 9% increase in difficulty.

Bitcoin difficulty:
Euphoria and Capitulation:
Large volumes of bitcoin historically move for one or two reasons :
1) Euphoria(price top)
2) Capitulation(price bottom)
Euphoria occurs when the subset of Bitcoiners are so wealthy that they need to cash out the holdings of bitcoin to diversify their portfolio .
Capitulation occur=s when strong hands gets seriously tested and some break under pressure .After they break the strong hands are the only users remaining and it historically marks the bottom.

HODL waves:
This metric visualizes the periods of euphoria.

S2F model:
